
If you want to know how to improve employee engagement at your company, you are not alone. Most HR directors and executives know engagement is a problem. They just are not sure what is actually causing it or what to do about it. The good news is that experts around the world have researched this topic extensively. As a result, we know what drives engagement and what kills it. We know what moves the numbers in a positive direction.
And we also know what does not work — which turns out to be what most companies are spending their workforce engagement budgets on.
This post is a summary of some of the most compelling data related to Workforce Engagement. Below are 35 interesting employee engagement statistics for 2026 that every HR leader needs to know. (We also linked to all of our primary sources.) Below the statistics, our experts will give you the seven things worth actually measuring, the two root causes most companies never address. And finally — perhaps most usefully — we included a list of widely circulated FAKE employee engagement statistics! During our research, we kept coming across these same statistics over and over. Apparently, other posts keep reprinting them because they never actually checked the original source. We did.
If you landed here first, you may also want to read a related post titled Most Employee Engagement Activities Aren’t Engaging Employees. It covers why many of the activities companies spend money on are actively making things worse.
35 Compelling Employee Engagement Statistics That You Need to Know in 2026
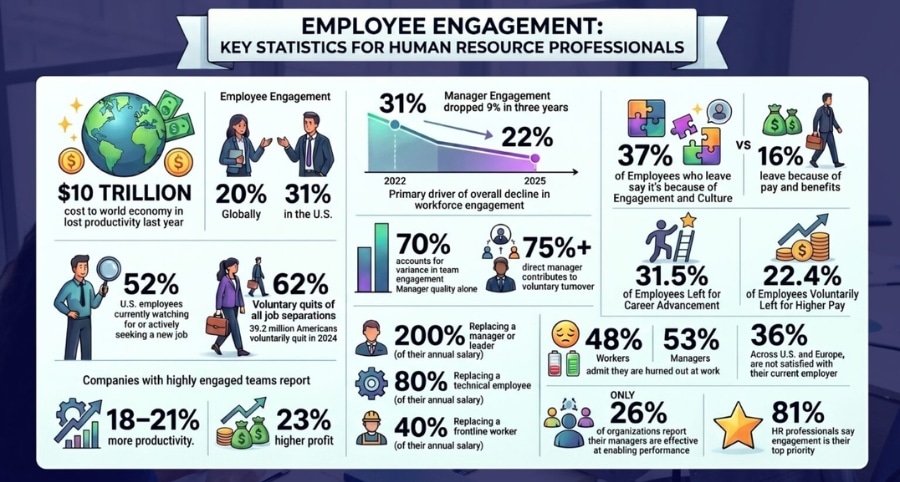
- Low employee engagement cost the world economy $10 trillion in lost productivity last year. Global engagement has dropped to just 20%. That number is slightly better in the U.S. at 31%.
- Manager engagement dropped from 31% in 2022 to 22% in 2025 — the primary driver of the overall decline in workforce engagement. Manager quality alone accounts for 70% of the variance in team engagement.
- 52% of U.S. employees are currently watching for or actively seeking a new job. In 2024 alone, 39.2 million Americans voluntarily quit — accounting for 62% of all job separations.
- The #1 reason employees leave is Engagement and Culture (37%) — four times more common than pay and benefits (16%).
- When employees do cite a specific reason for leaving, the most common answer is career advancement opportunities (31.5%) — not pay, which ranks second at only 22.4%.
- The employee’s direct manager contributes to over 75% of voluntary turnover.
- Replacing a manager or leader costs approximately 200% of their annual salary. Replacing a technical employee costs 80%. Replacing a frontline worker costs 40%.
- 48% of workers and 53% of managers admit they are burned out at work.
- 36% of employees across the U.S. and Europe are not satisfied with their current employer.
- Only 26% of organizations report their managers are effective at enabling performance. But 81% of HR professionals say engagement is their top priority.
- 61% of managers and 72% of workers say they do not trust their organization’s performance management process.
- Only 19% of leaders say they have reliable metrics for measuring employee wellbeing outcomes.
- Companies with highly engaged teams have 78% fewer unplanned absences than companies with disengaged teams.
- They also report 18–21% more productivity than companies with disengaged teams.
- Companies with highly engaged teams report 23% higher profit than companies with disengaged teams.
- And these companies experience 51% less employee turnover than companies with disengaged teams.
- Only 3 in 10 employees received recognition or praise for good work in the last seven days — and only 22% say they get the right amount of recognition at all. That number has not changed since 2022.
- Well-recognized employees are 45% less likely to have left their organization two years later.
- Only 20% of employees had a conversation with their manager in the last six months about steps to reach their goals. Only 1 in 3 strongly agree their opinion counts at work. Only 4 in 10 strongly agree their company’s mission makes them feel their job is important.
Sources: Gallup 2026 State of the Global Workplace Report | Gallup Q12 Meta-Analysis, 11th Edition | Gallup Employee Retention and Attraction Global Indicator | Gallup: Turning Around Employee Turnover | Gallup and Workhuman: Employee Retention Depends on Getting Recognition Right | Gallup: 8 Behaviors of the World’s Best Managers | McKinsey HR Monitor 2025 | Deloitte 2025 Global Human Capital Trends | U.S. Bureau of Labor Statistics JOLTS | SHRM 2025 State of the Workplace
To Really Improve Employee Engagement, Stop Measuring Satisfaction and Start Measuring These Seven Things.
Here is a question worth asking before your next workforce engagement survey goes out. What exactly are you measuring?
Most companies measure satisfaction. They ask employees how happy they are, whether they enjoy their work, whether they would recommend the company to a friend. Those are fine questions. But satisfaction and engagement are not the same thing.
A satisfied employee can still be disengaged — showing up, doing the minimum, and collecting a paycheck without investing anything extra. What you actually want to know is whether your employees are behaviorally engaged — whether their day-to-day actions show it. And for that, you need different measurements.
Here are the seven metrics the research actually validates as predictors of real engagement:
1. Absenteeism Rate — Including Work from Home (WFH) Avoidance Patterns.
Unplanned absences are the fastest behavioral signal of disengagement. The Gallup Q12 Meta-Analysis found top-quartile engagement teams show 78% lower absenteeism than bottom-quartile teams. Pay particular attention to patterns — employees who frequently call in on days they are required to be in the office are signaling something specific. That pattern deserves a conversation, not a policy memo.
2. Employee Turnover Rate (Especially, but Not Exclusively, Voluntary Turnover).
Who is choosing to leave, and how often? According to Gallup’s turnover research, engagement elements explain 96% of the attitudes that drive voluntary turnover rates for work units. Voluntary turnover is the most expensive engagement failure a company can have — replacing a manager costs roughly 200% of their annual salary. Track it by team, by manager, and by tenure. The patterns will tell you where the real problems are. Unvoluntary employee turnover may be an even bigger problem. It can show that we are hiring the wrong people for the wrong jobs.
3. Manager Effectiveness Scores.
The single most important number in your engagement data is how employees rate their direct manager. Gallup’s research shows that manager quality accounts for 70% of the variance in team engagement. If your managers are not being measured, your engagement initiative has a large blind spot.
4. Recognition Frequency.
Only 3 in 10 U.S. employees strongly agree they received recognition or praise for good work in the last seven days. That is not a morale problem — it is a management behavior problem. Track how often managers are recognizing their people. The Gallup and Workhuman research found that employees who receive high-quality recognition are 45% less likely to have left their organization two years later. Recognition is not a nice-to-have. It is an important retention tool.
5. Conversation Frequency between Manager and Direct Reports.
Only 20% of U.S. employees strongly agree they had a development conversation with their manager in the last six months. Gallup’s research found that in moderately to highly engaged workplaces, teams where employees discussed their progress with a manager in the past six months report 19% less turnover. This one is almost free to fix — it costs nothing but a calendar block and a willingness to talk to your team.
6. Productivity Output.
Engagement and productivity are directly linked. The Q12 Meta-Analysis found top-quartile engagement teams show 18–21% higher productivity than bottom-quartile teams. Productivity is measurable in roles with clear deliverables — sales quotas, project completion rates, output volume. In professional industries, it takes more creativity to measure, but missed deadlines, rework rates, and output quality will give you a better picture of how productive your professionals are.
7. Internal Mobility and Promotion Rate.
Are your employees raising their hands for new opportunities, stretch assignments, and internal transfers? Or are they keeping their heads down? Low internal mobility is a quiet signal of disengagement. Engaged employees want to grow. They volunteer for things. They ask for more responsibility. When that stops happening across a team or department, the data is telling you something.
Once you are measuring the right things, the data will almost always point you toward one of two root causes. Let’s cover both.
If Your Data Points to the Manager as the Problem, Train Your Manager to Be a Better Coach.
The research on this point is as clear as it gets. Manager quality accounts for 70% of the variance in team engagement. That means most engagement problems are manager problems wearing an engagement costume.
The challenge is that most managers were never trained to manage. They were great at their job — in sales, in engineering, in operations — and someone promoted them. Now they are responsible for the development, motivation, and daily experience of the people who report to them, and nobody taught them how to do that. The Gallup research on the world’s best managers found that most managers learn management from the managers they had — who may have been good or bad — or from stereotypes about what leadership looks like. Neither is a reliable way to build a great coach.
So what does a great manager-coach actually do?
Here are the Ones that Move the Employee Engagement Needle Most Directly.
- Have one meaningful conversation per week with each team member. Not a status update. Not a performance review. A real conversation about what the person is working on, what they are struggling with, and what they need. Only 20% of employees say this happens for them. It is the single highest-leverage behavior available to a manager.
- Connect individual work to company purpose. Only 4 in 10 employees strongly agree that the company’s mission makes them feel their job is important. That number is not an employee problem — it is a manager communication problem. Great managers consistently help their people see how their daily work connects to something larger.
- Recognize and reward good work frequently. Only 3 in 10 employees received meaningful recognition in the last seven days. Great managers do not wait for annual reviews. They catch people doing things right in real time and say so — specifically, authentically, and often.
- Ask for opinions and act on them. Only 1 in 3 employees strongly agree their opinion counts at work. Great managers ask questions, listen to the answers, and close the loop. When an employee’s idea is implemented, say so. When it is not, explain why. Either way, people feel heard.
- Coach toward growth, not just performance. The Gallup research found that teams where employees discussed their progress with their manager in the last six months report 19% less turnover. This is a development conversation, not a performance conversation. It asks: where do you want to go, and how can I help you get there?
If your engagement data shows low scores on manager effectiveness, recognition frequency, or progress conversation frequency — that is your diagnosis. The prescription is manager development. Not a team-building day. Not a survey. Training that teaches managers to coach.
If Your Data Points to Job Fit, Move People to Roles That Use Their Strengths.
Years ago, I hired a leadership consultant who was an expert at turning around retail stores. Her boss would give her the worst-performing store. She’d train the staff, cut the waste, and increase revenue. Then, before long, the worst store would become the best in the chain. She did this three years in a row before becoming a leadership consultant for me.
Her training was just as sharp. She made her students feel comfortable, and they’d leave her training feeling like they could accomplish anything. But a lot of the consulting position is a sales role as well. She struggled with this role. She was so valuable that I didn’t want to fire her. But I also couldn’t keep wasting opportunities. Eventually, I realized that her management skills, attention to detail, and ability to coach hourly workers made her ideal for our logistics manager. We moved her over, and warehouse and shipping mistakes dropped to almost zero.
She was (still is) a very valuable part of our team. We just needed to put her in a position where her talents and strengths could be used more effectively.
Not every engagement problem is a manager problem. Sometimes the data points somewhere else entirely. When employees score low on “opportunity to do what I do best every day” — one of Gallup’s core Q12 items — the issue is not their manager. The issue is job fit.
According to Gallup’s Employee Retention and Attraction research, 20% of employees who voluntarily left their job in 2024 cited lack of job fit as their primary reason. That is one in five voluntary departures — preventable departures — caused not by bad management or bad pay, but by putting the right person in the wrong role.
A Few Tips to Help You Keep Good People by Finding a Better Job-Fit for Them.
The Gallup Q12 item on this is specific: “At work, I have the opportunity to do what I do best every day.” When employees strongly agree with that statement, engagement goes up. When they don’t, it doesn’t matter how good their manager is, how much they are paid, or how many team-building activities the company runs. A person doing work they are fundamentally wrong for will disengage. Eventually, they will leave.
The fix is straightforward in principle, even when it is hard in practice. Here is what it looks like:
- Identify the mismatch before it becomes a resignation. Stay interviews — proactive one-on-ones with currently employed people asking what would make them leave — surface job fit problems before exit interviews do. Most companies only discover the mismatch after the person has already decided to go. By then it is too late and expensive.
- Restructure the role before replacing the person. Great managers look for ways to shift responsibilities within a role to better match a person’s natural strengths. Sometimes a small adjustment — moving someone from client-facing to analytical work, or from solo execution to team coordination — changes everything. It costs nothing, and it takes a conversation.
- Move people laterally before they walk out the door. Internal mobility is one of the seven engagement metrics listed above for a reason. Companies with strong internal mobility retain engaged employees who might otherwise leave for a better fit somewhere else. A lateral move to a role that uses a person’s strengths beats losing them to a competitor every time.
The combination of the right manager and the right role is what Gallup’s research consistently points to as the foundation of genuine workforce engagement. Get both right, and the other metrics — absenteeism, turnover, productivity, recognition — tend to follow.
Before You Use Any Employee Engagement Statistics, Check These Commonly Misquoted Ones First.
One last thing worth covering — because it is directly relevant to any HR professional trying to make the case for engagement investment to leadership.
The internet is full of employee engagement statistics. Many of them are wrong. Not slightly off — meaningfully wrong, in ways that could embarrass you in a boardroom if you cite them without checking. Here are the most commonly misquoted ones we found circulating on team-building company websites and HR blogs, along with what the original sources actually say:
“Only 15% of employees worldwide are engaged.” This figure comes from Gallup’s 2017 State of the Global Workplace report — nearly a decade old. Dozens of HR blogs still cite it as current. The actual 2026 figure is 20% globally and 31% in the U.S. Still bad. But not 15%.
“70% of employees hate their job.” We found this published on a major team-building company’s website with no source attached. There is no Gallup, SHRM, McKinsey, or any other primary research that says 70% of employees hate their jobs. What Gallup actually says is that 69% of U.S. employees are not engaged or actively disengaged — which is very different from hating their job. Not engaged means uninvested, not miserable.
“Engaged employees are 87% less likely to leave.” This number appears on multiple HR software and team-building sites with no source. We’ve been unable to find a direct source for the statistic. The actual figures from the Q12 Meta-Analysis are 51% lower turnover for low-turnover organizations and 21% lower for high-turnover organizations — both significant, neither 87%.
“Engaged employees show an 84% improvement in absenteeism.” Like some of the other statistics, we were not able to trace this statistic to a real study. It is close to the figure from the Q12 Meta-Analysis, which was 78% lower absenteeism. It’s possible that this statistic is just outdated now and was accurate during earlier studies.
“83% of Millennials are more loyal to companies with CSR programs.” The actual finding from the 2016 Cone Communications Millennial Employee Engagement Study is that 83% of Millennials would be more loyal to a company that helps them personally contribute to social and environmental issues. That is meaningfully different from simply having a CSR program. The study was also conducted by a PR firm that sold CSR strategy services to companies — worth knowing when you evaluate how the question was framed.
“Companies with strong workplace culture saw revenue grow by 682%.” This figure circulates widely with no traceable primary source. It appears to be a misreading of long-term stock performance data for companies on “Best Places to Work” lists — which is not the same as revenue growth, measured over different time periods, with no controlled comparison. Use it at your own risk in a boardroom.
The pattern across all of these is the same. One blogger cites a real statistic imprecisely. A second copies it without checking. By the time it has been reprinted fifty times, the number has drifted, the qualifier has been dropped, and the source has disappeared entirely. The only way to protect yourself is to go back to the original research — which is exactly what this post has tried to do.
The real statistics are damning enough. You do not need to invent fake ones.